Screenshots
The following screenshots show the Home dashboard and several reports in DesktopFinance, using sample data.
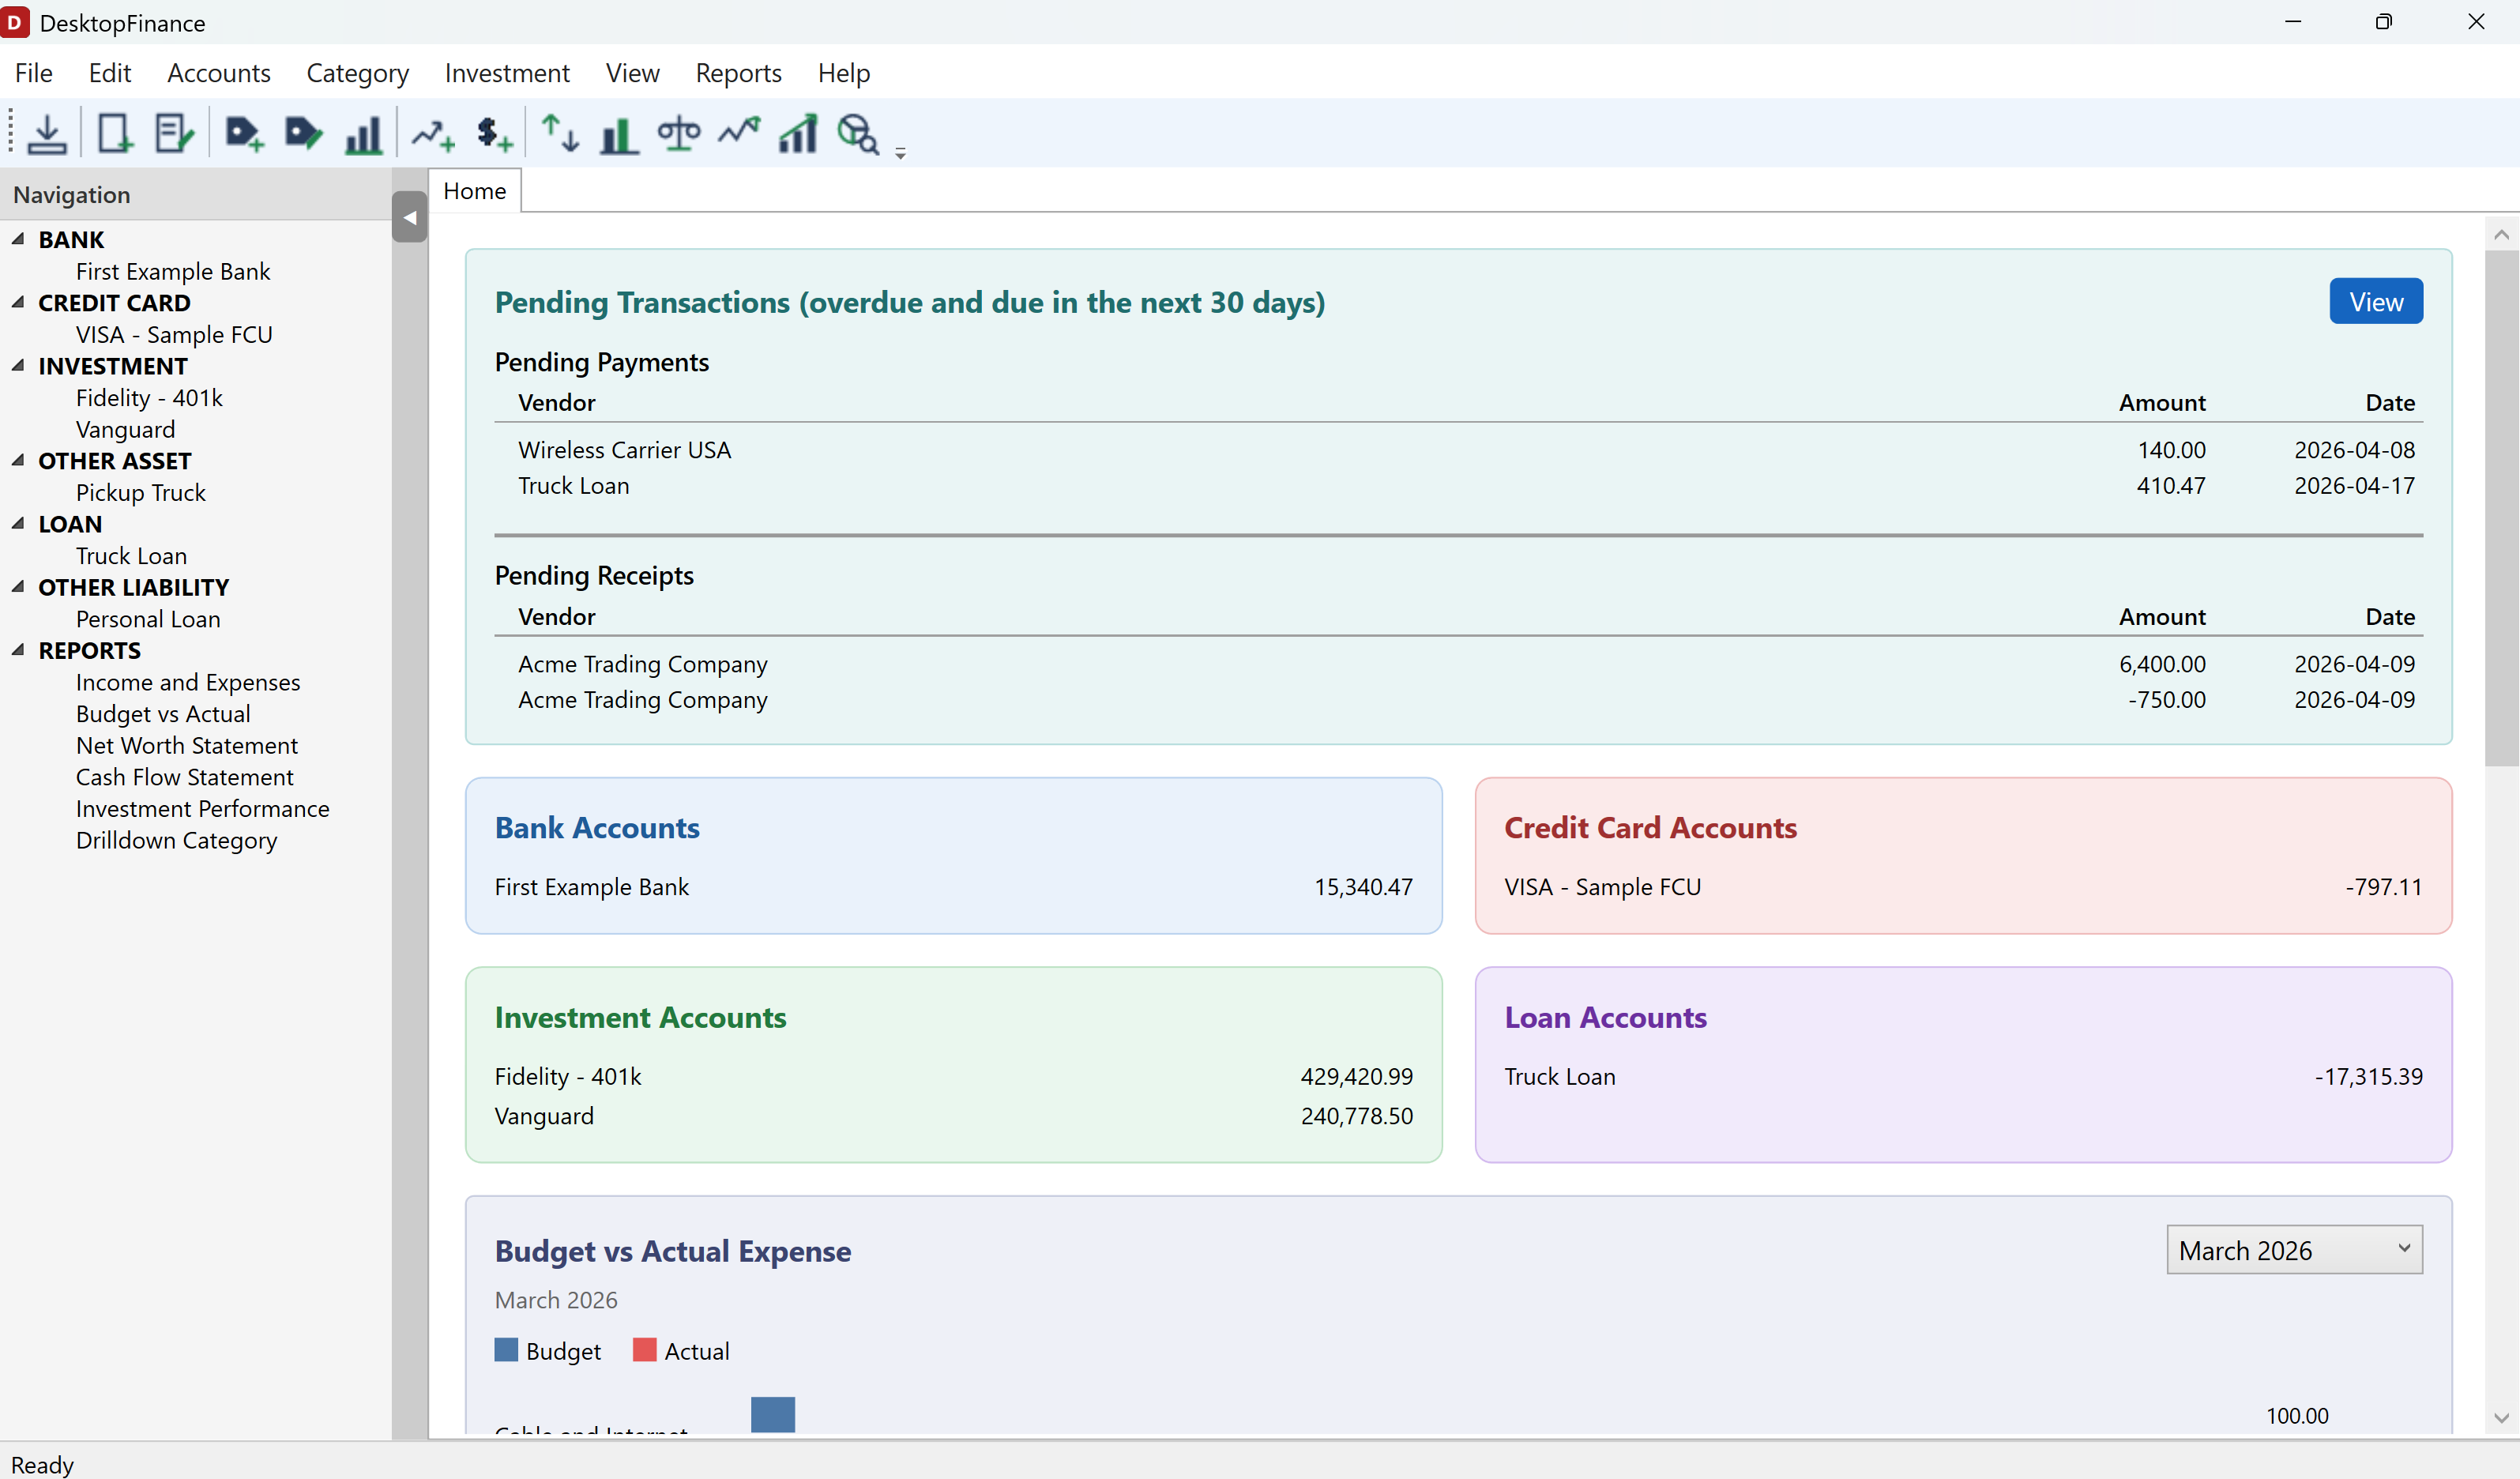
Home Dashboard
Pending payments and receipts due in the next 30 days, account balances grouped by type, and a budget vs. actual chart for the current month.
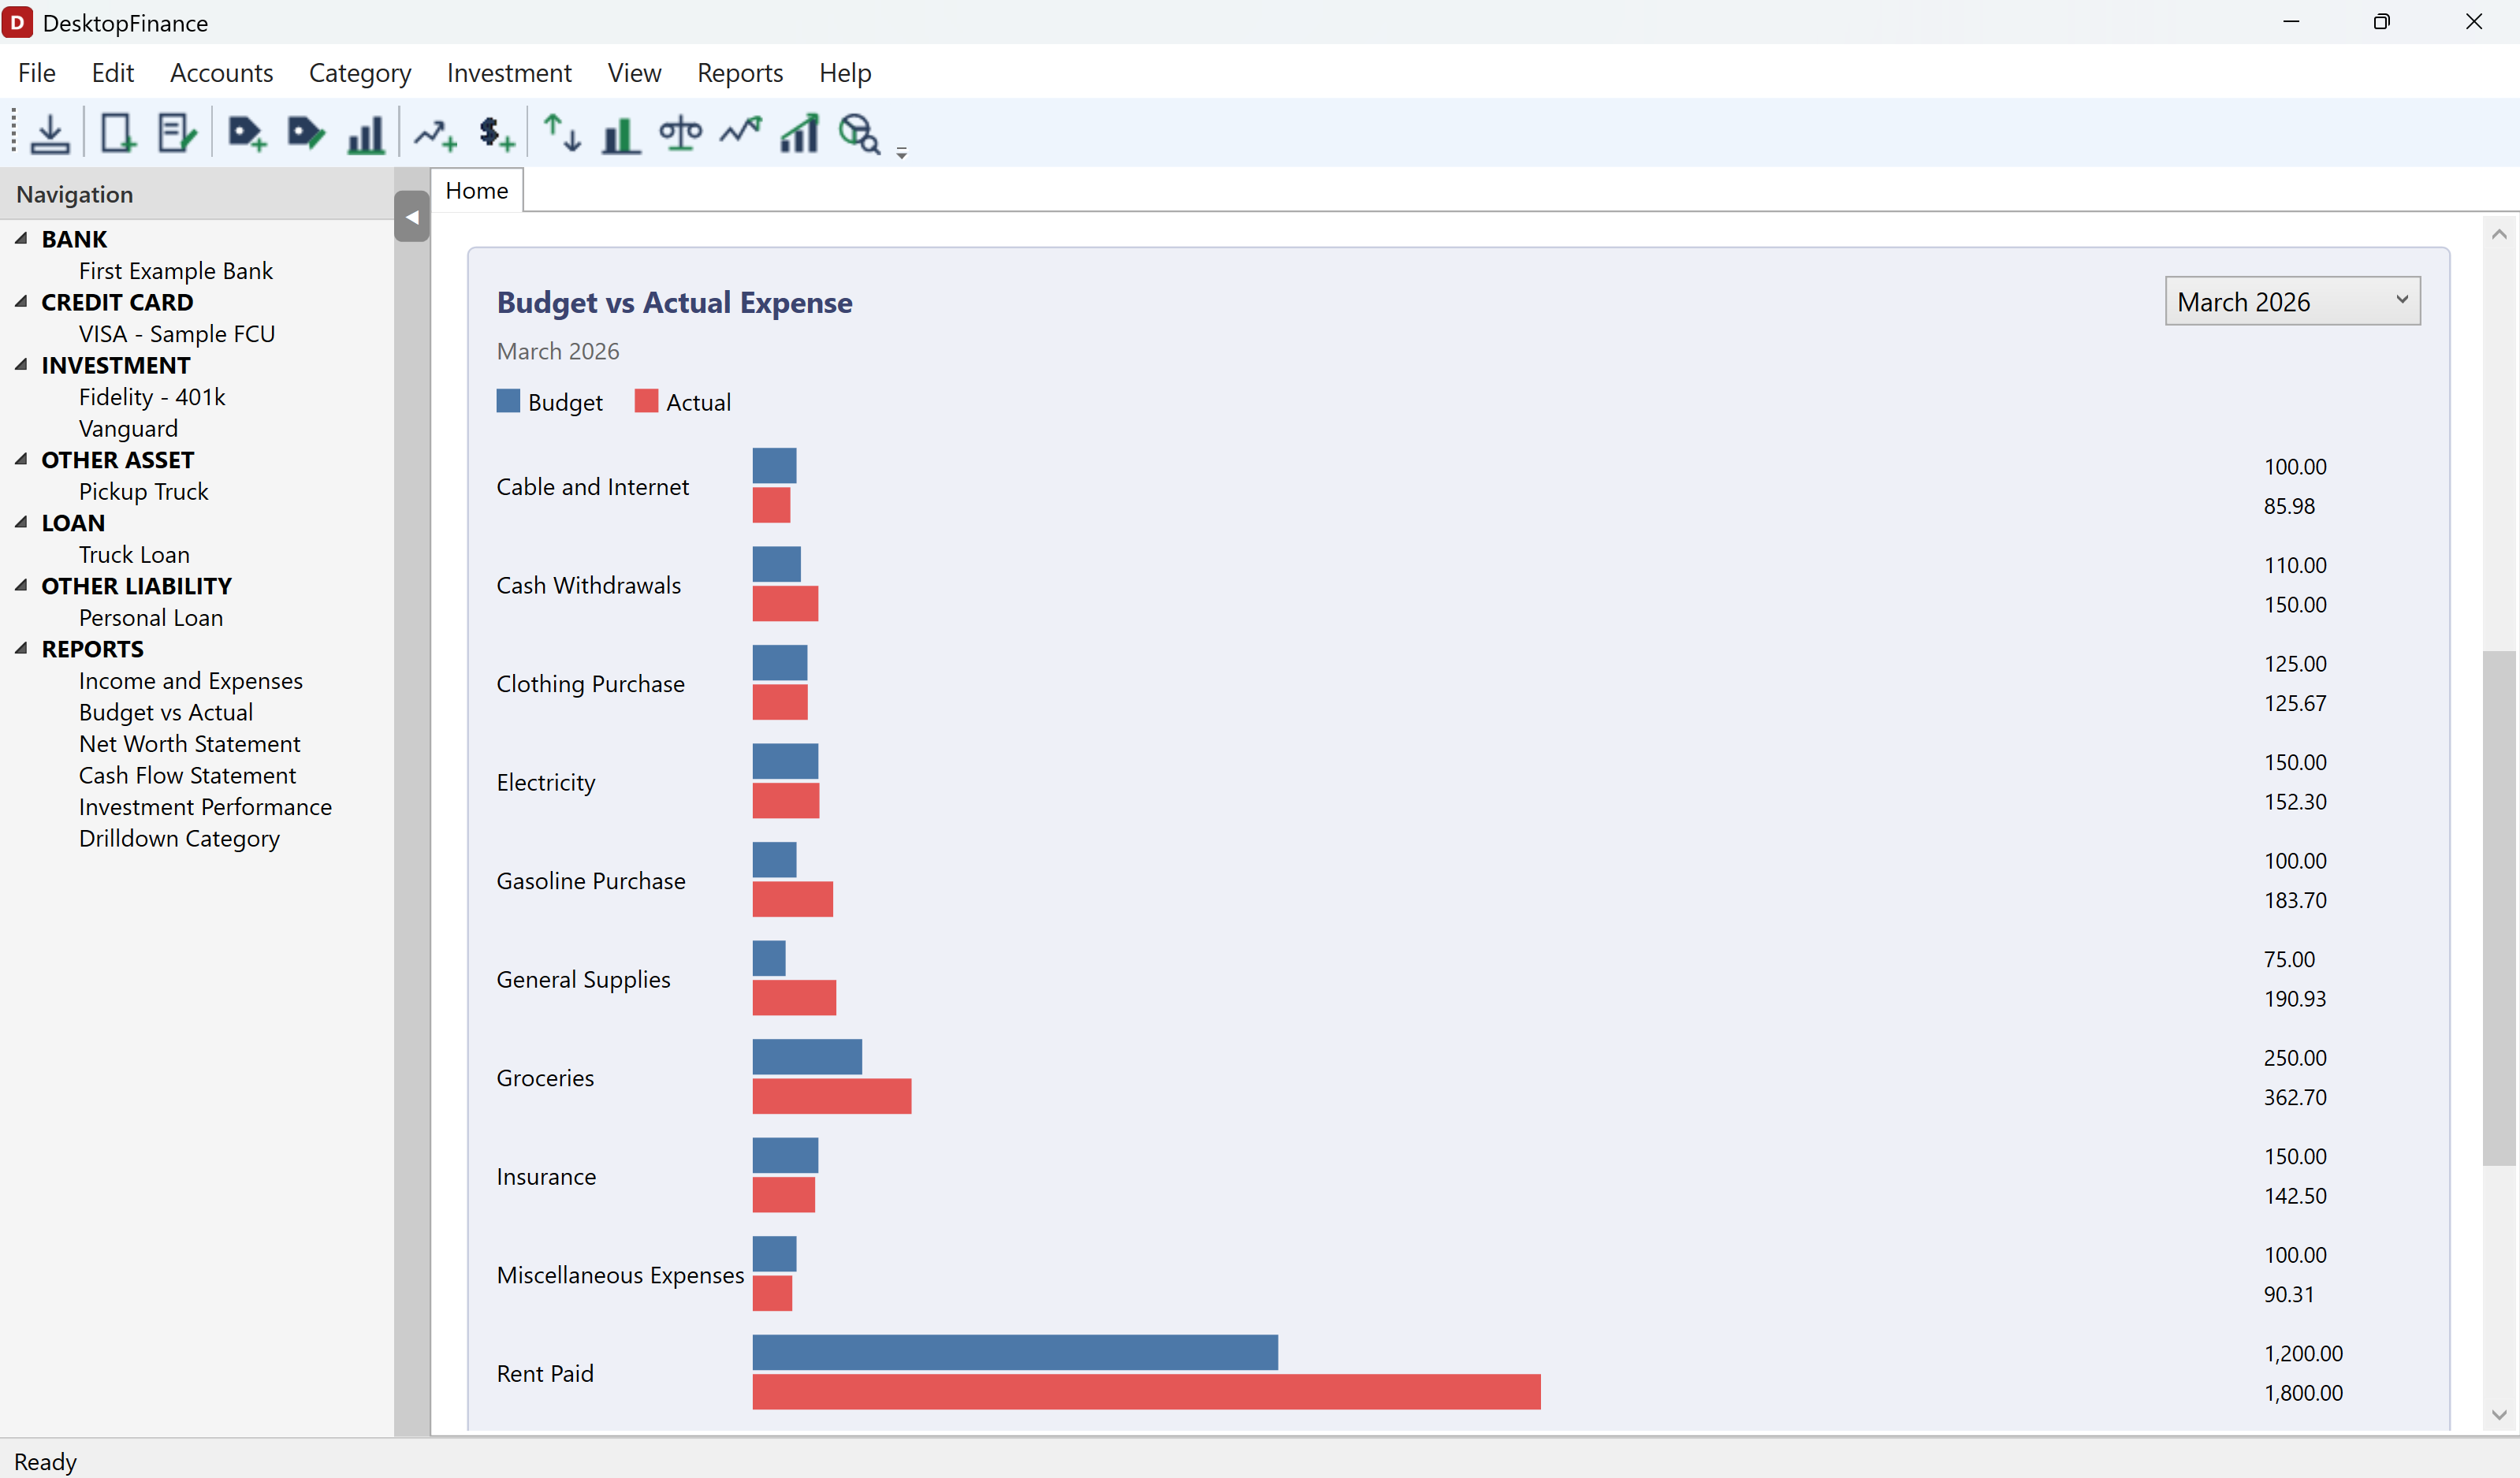
Budget vs. Actual (Home)
A closer view of the Home dashboard's budget chart, comparing budgeted and actual amounts side by side for each expense category.
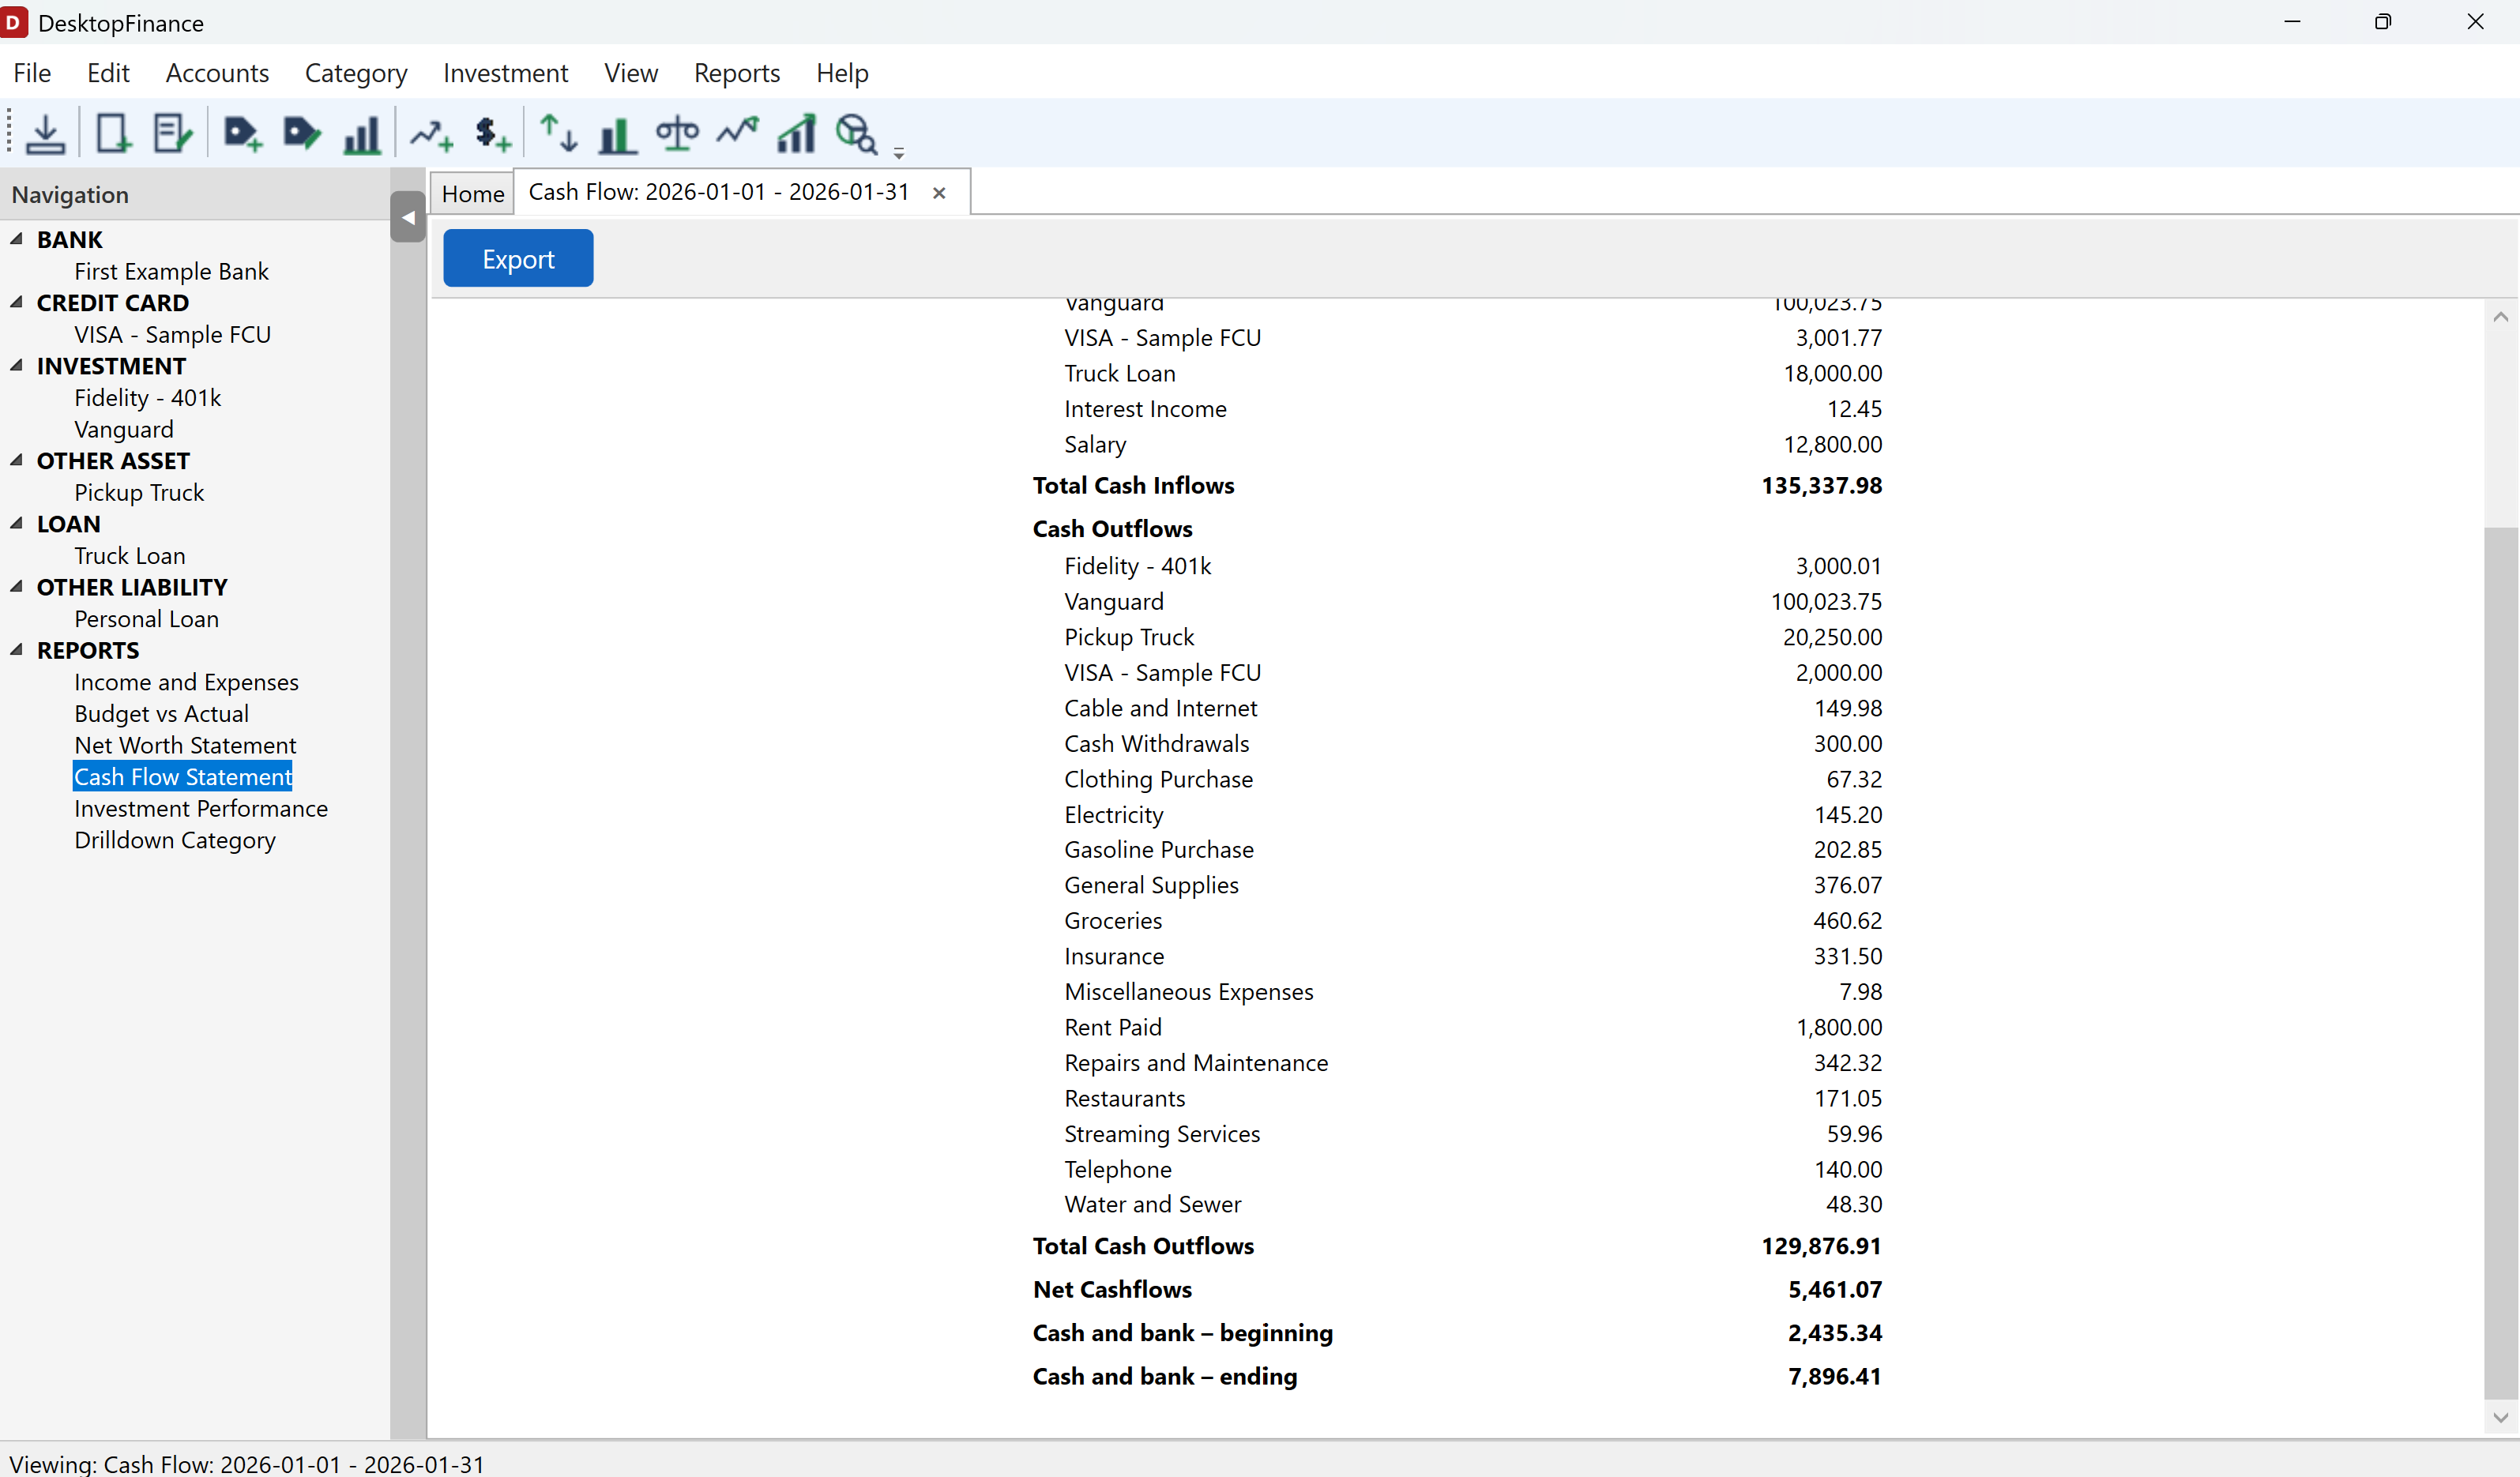
Cash Flow Statement
Cash inflows and outflows by category for a chosen period, with totals and the beginning and ending cash and bank balance.
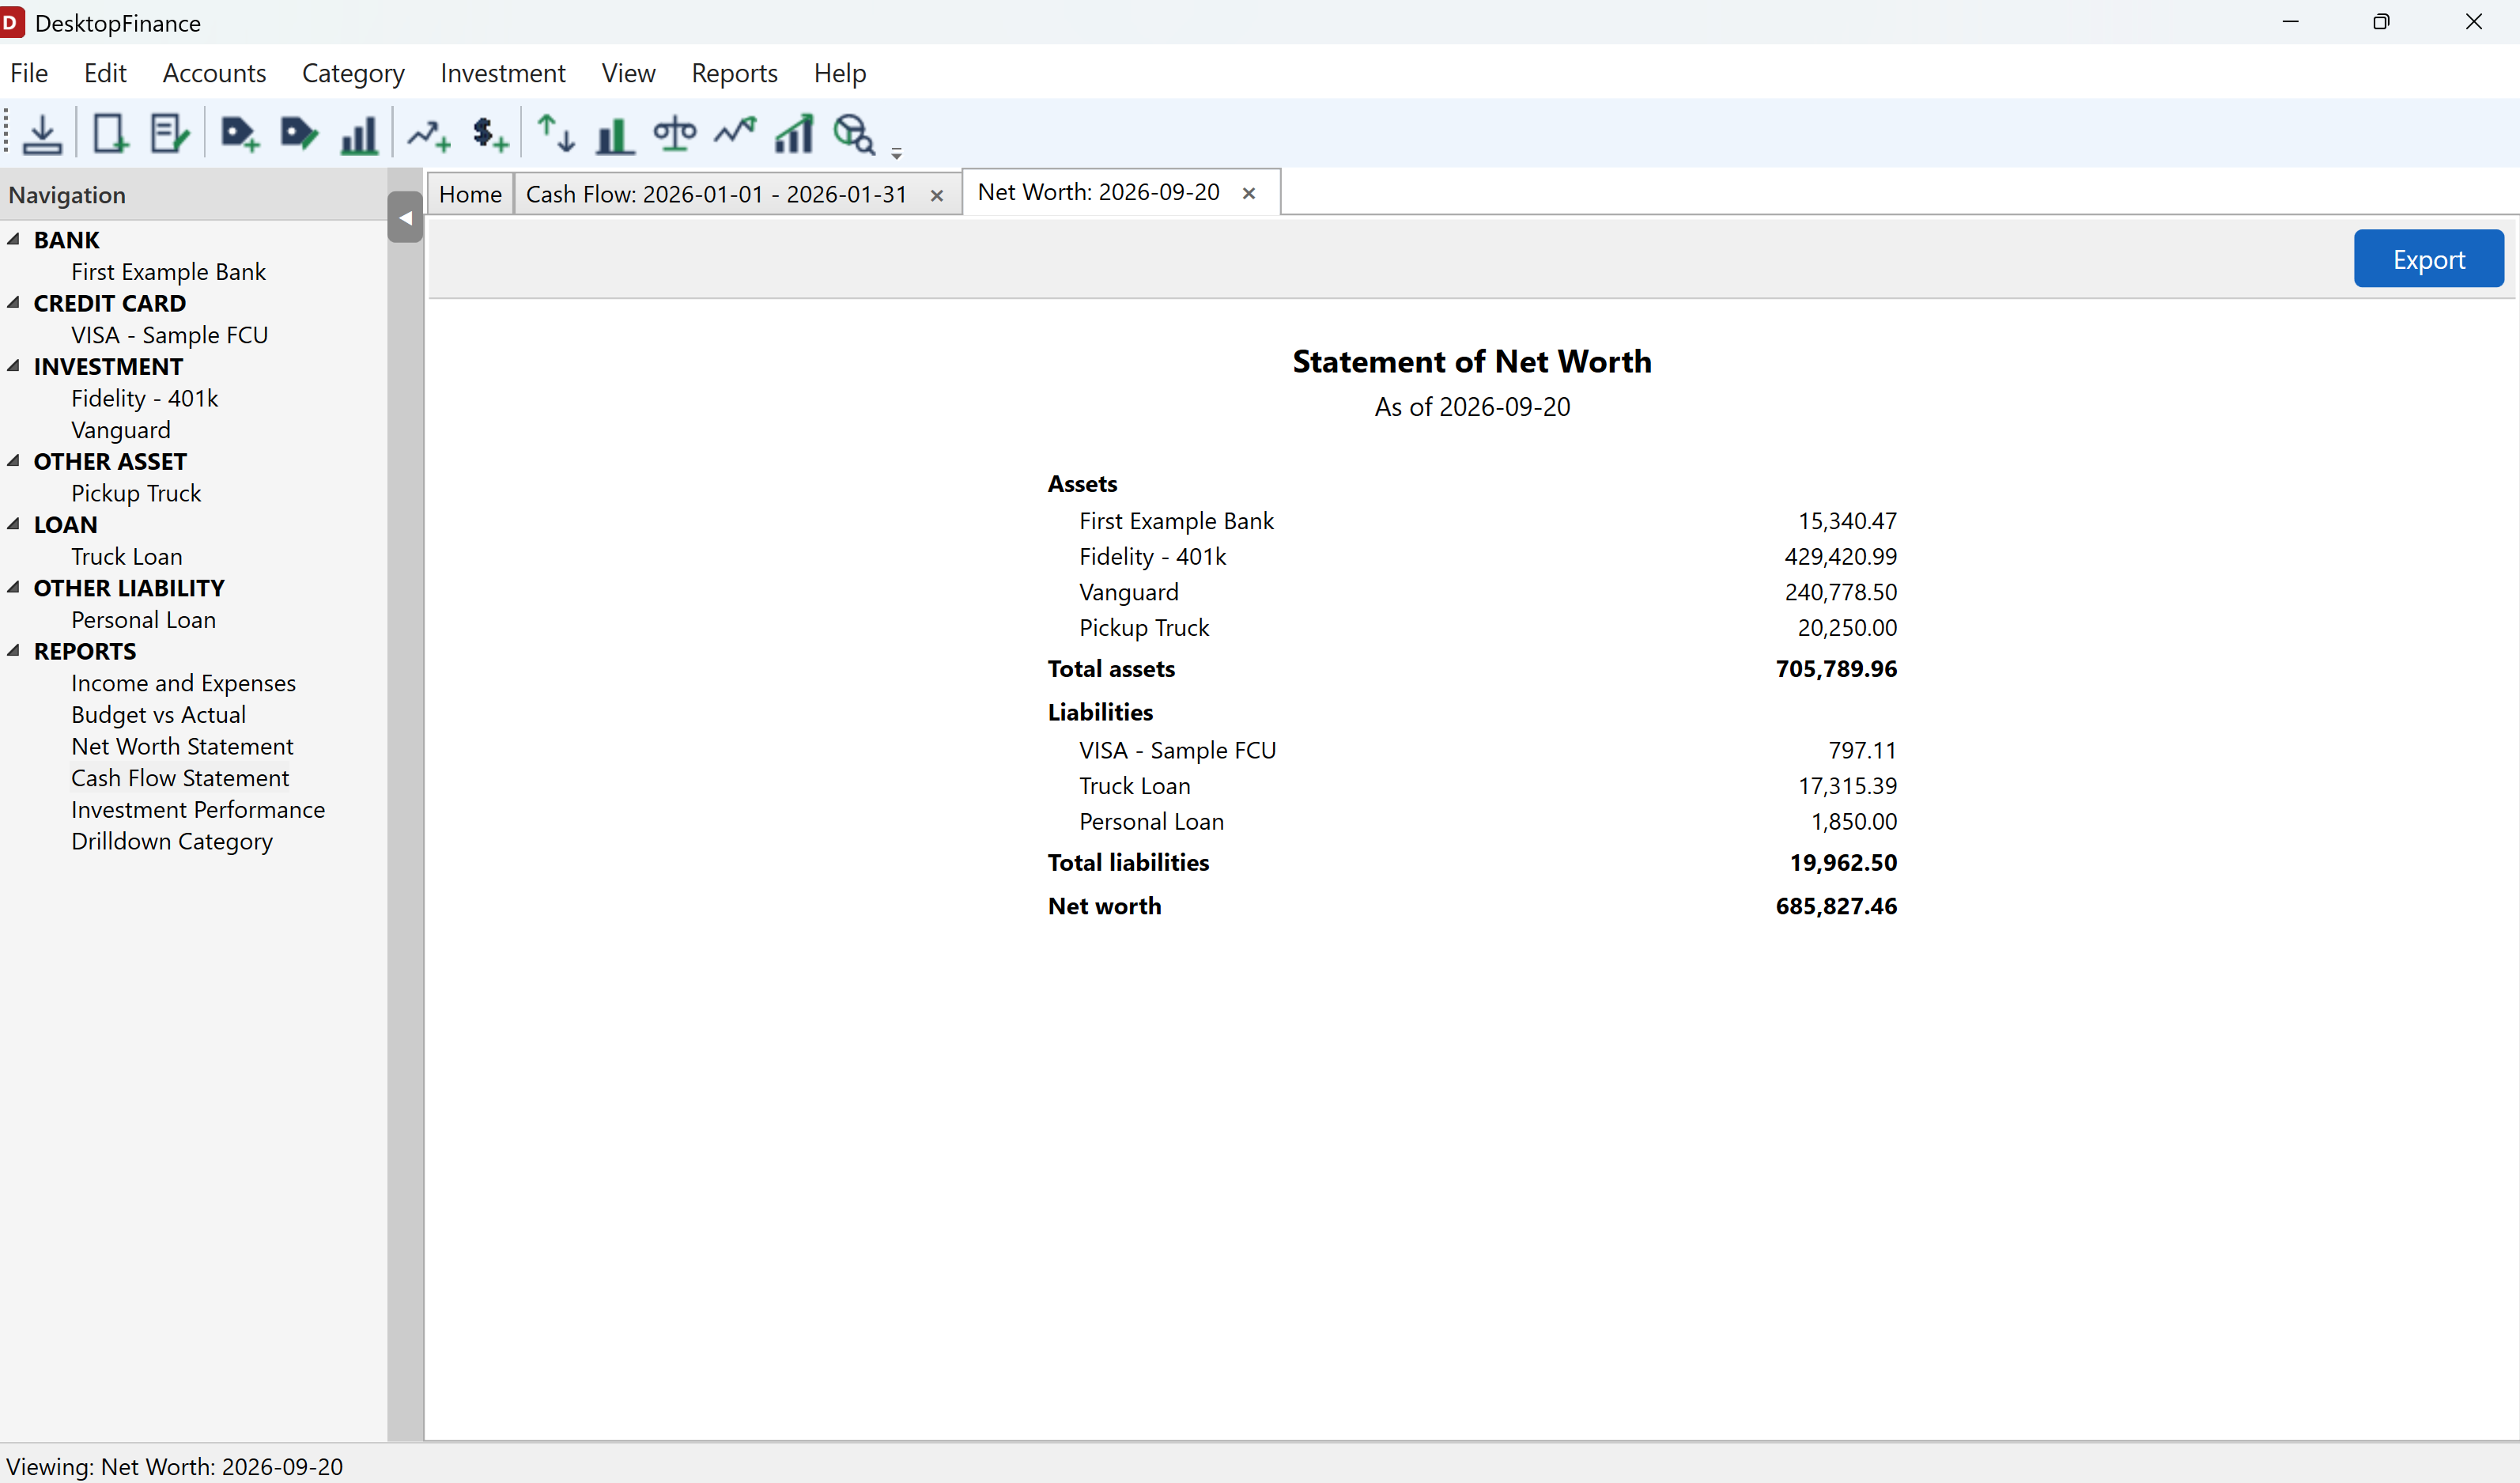
Net Worth Statement
Total assets and liabilities across all accounts as of a given date, with the resulting net worth.
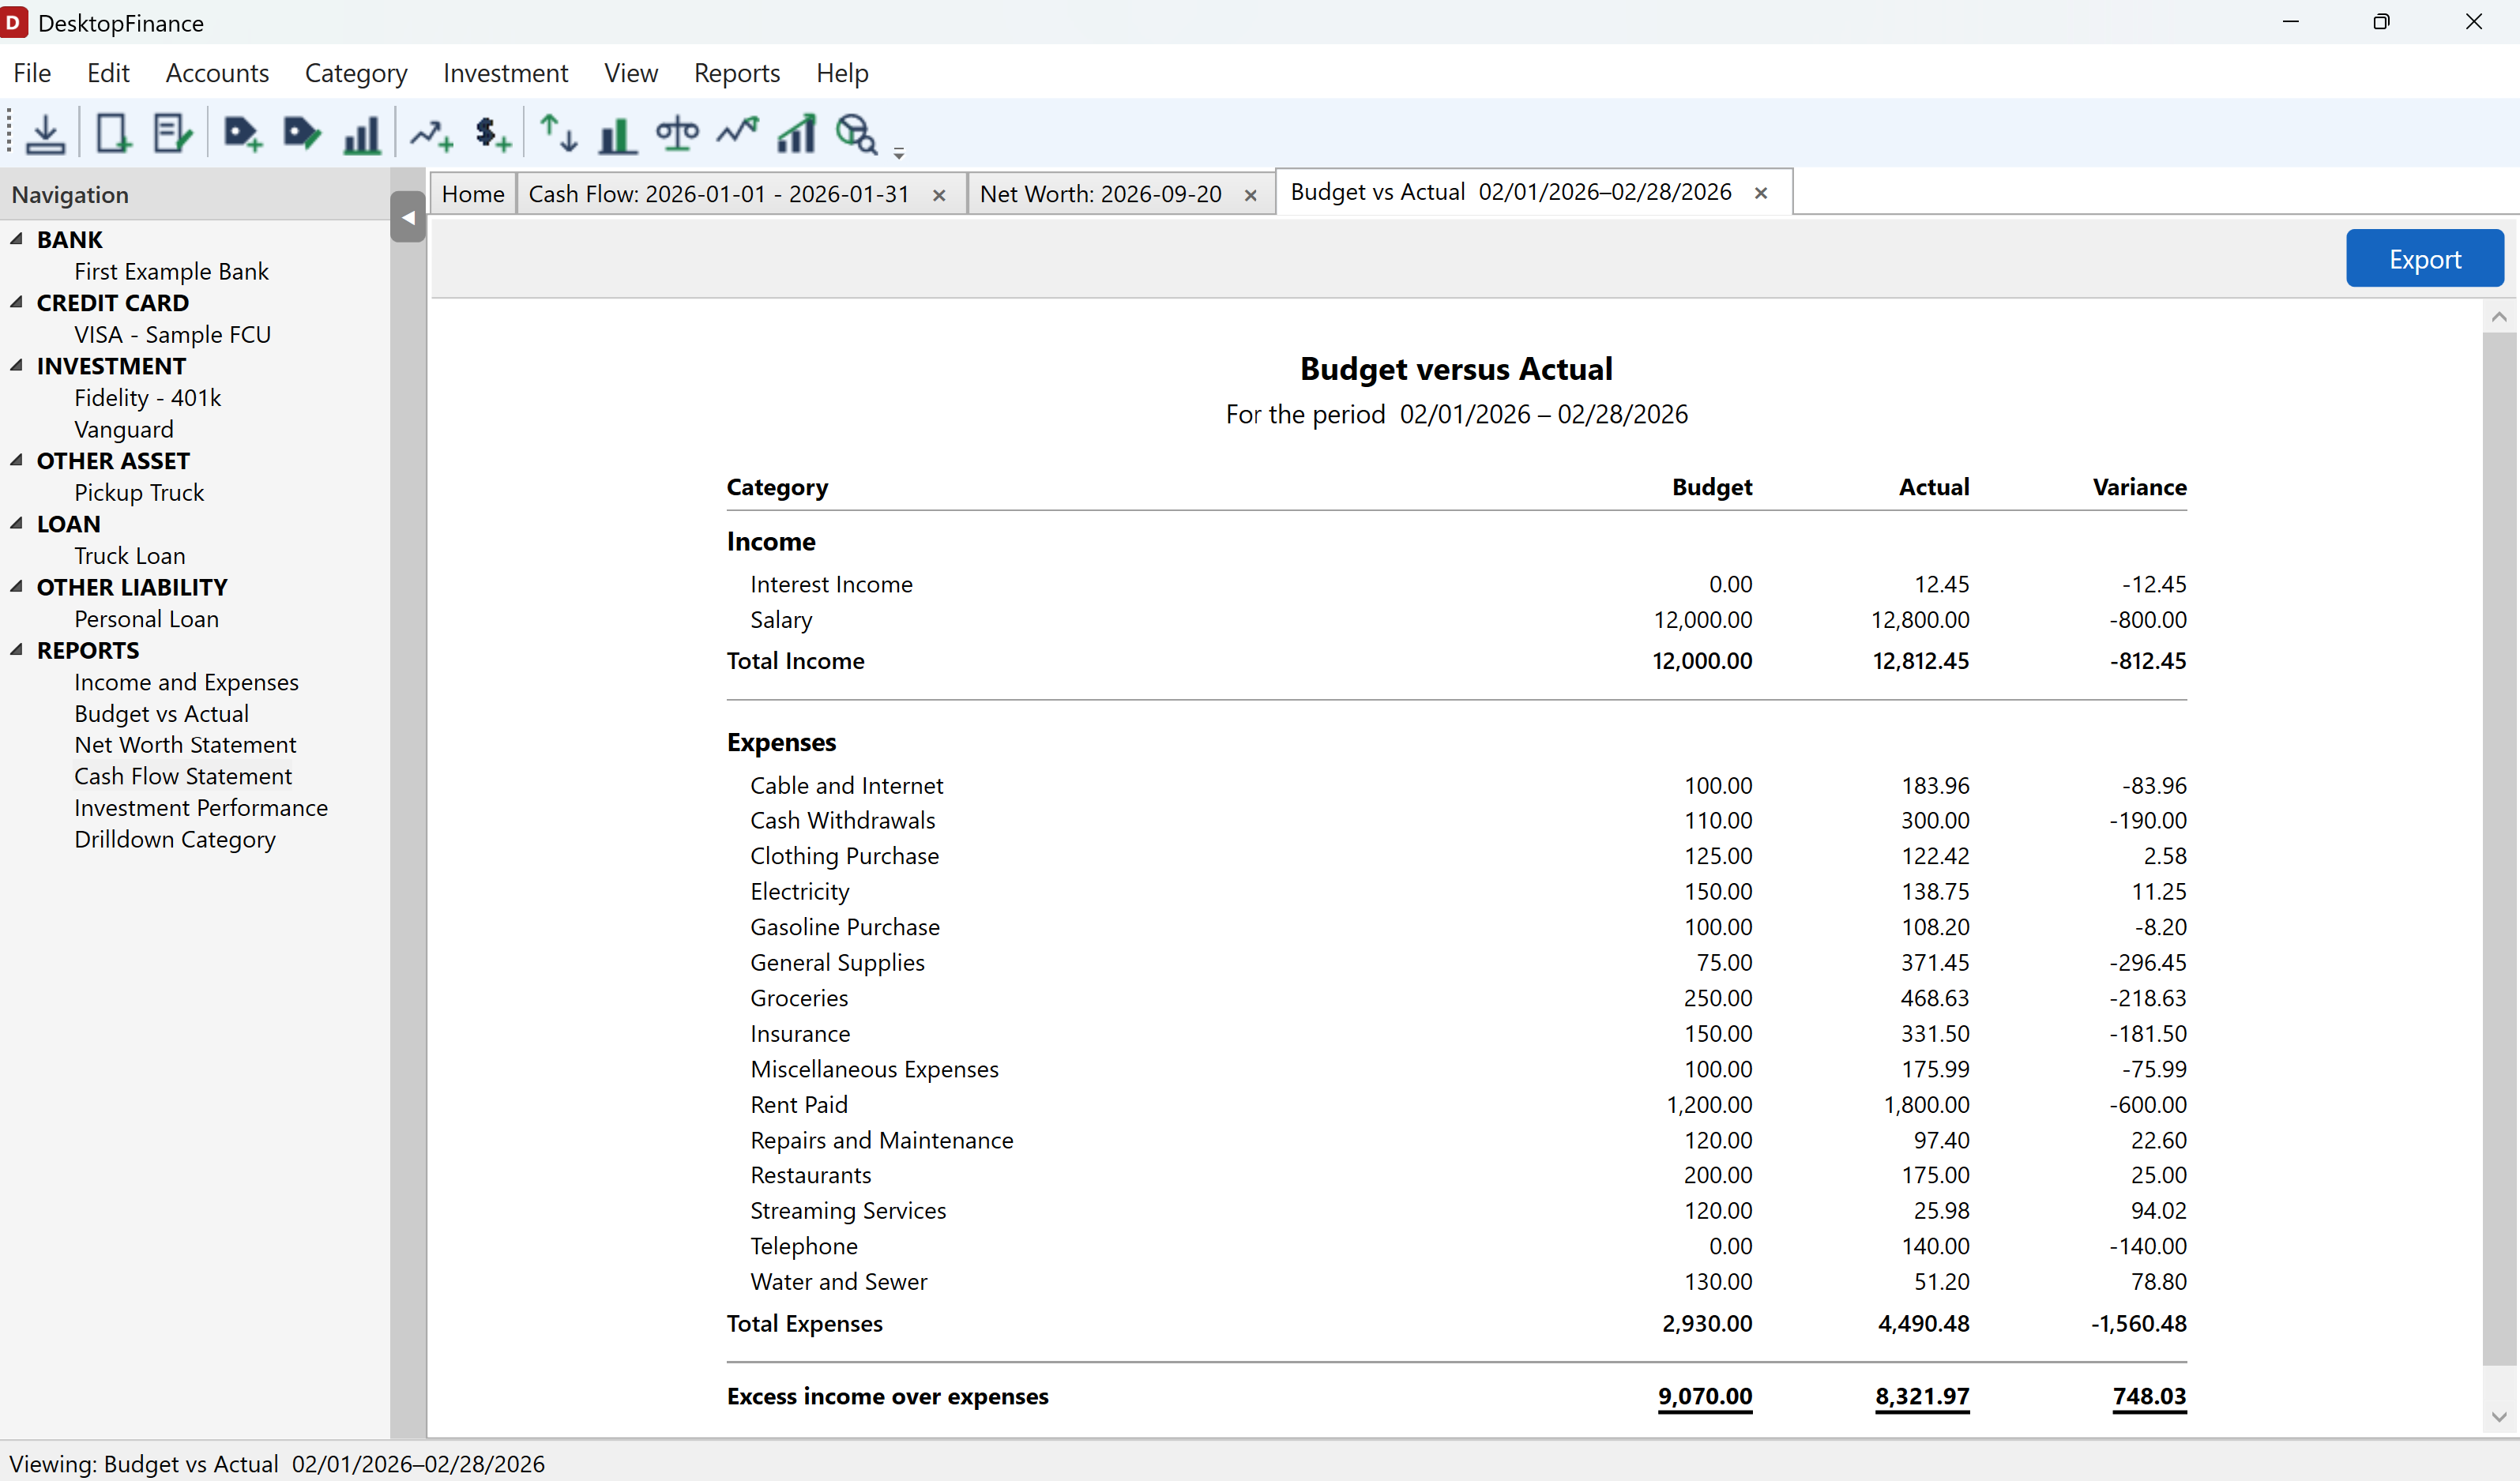
Budget vs. Actual Report
Budgeted and actual income and expenses by category for a chosen period, with the variance between them and the resulting excess of income over expenses.
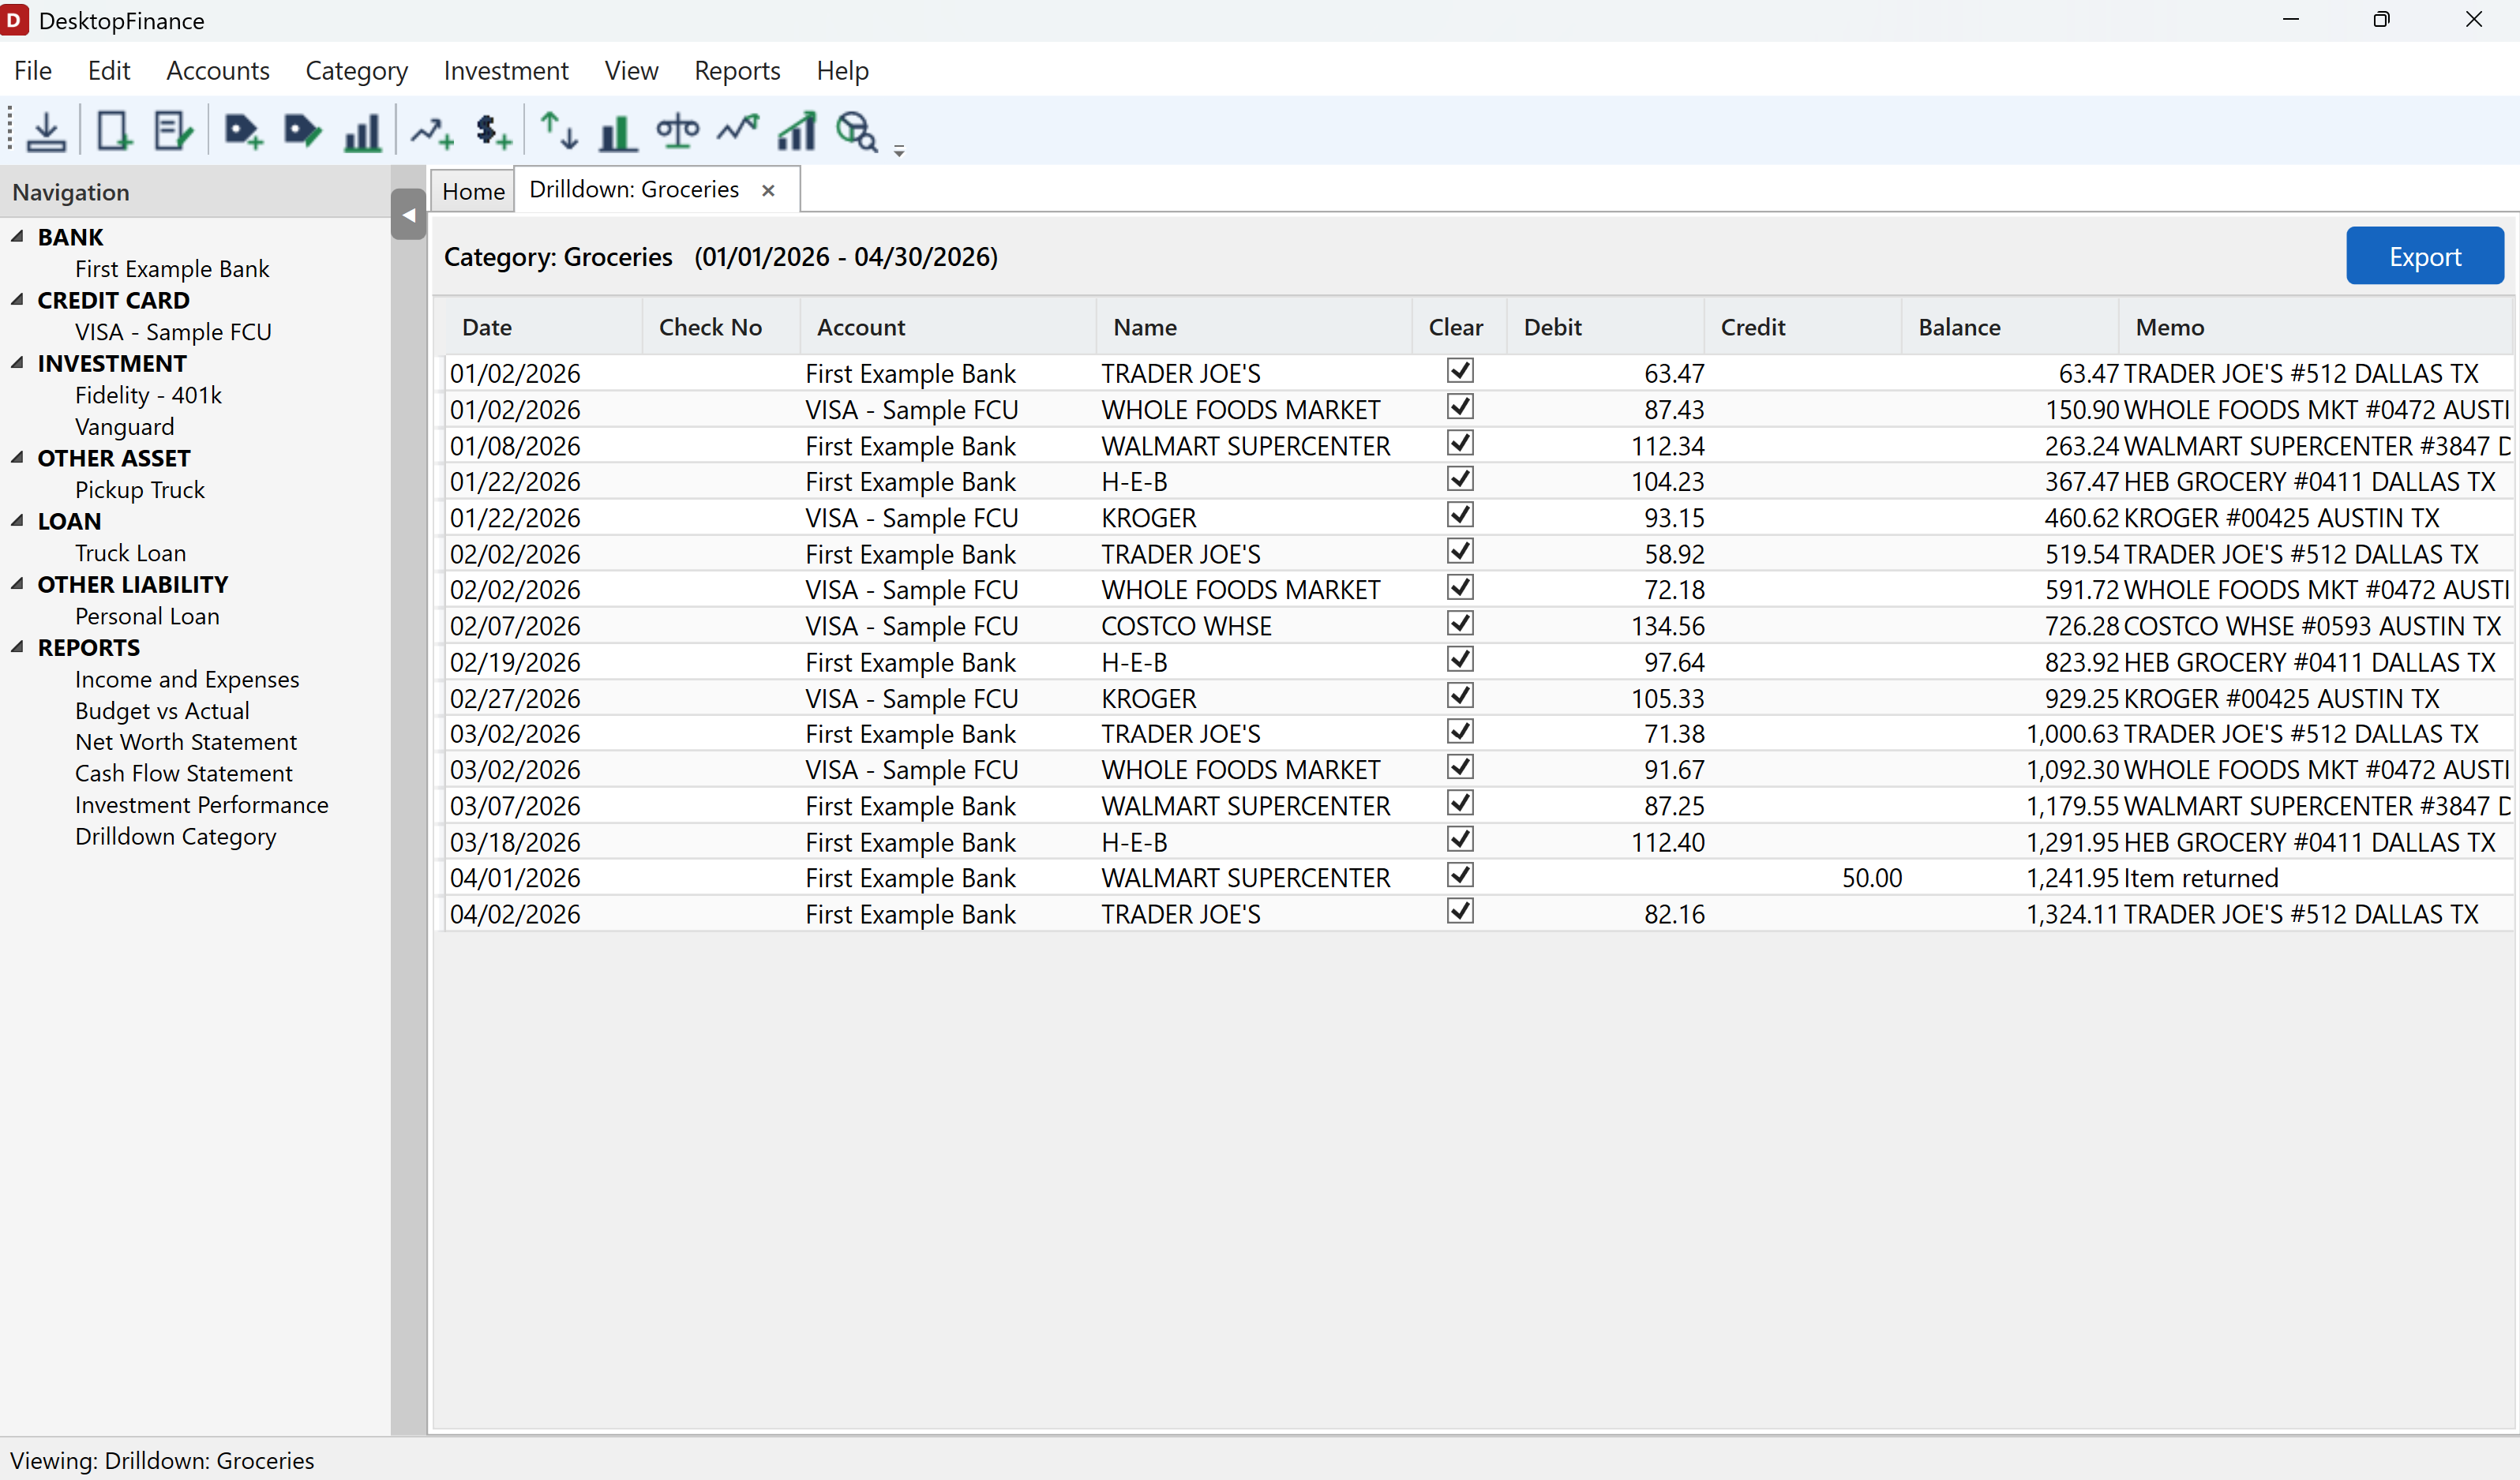
Account Drilldown
Account drilldown statement shows the detailed transaction history for a selected account for the selected period. All reports can be exported in CSV format.